

“What happens in the fund business is that the magic of compounding returns is overwhelmed by the tyranny of compounding costs.” – Jack Bogle, founder of the Vanguard group.
Let’s face it. Most of us significantly underestimate the long-term impact of compounding on investments. That is if we ever consider it in the first place! Whether in a DC plan or in personal investment accounts, when it comes to the cost of investing, that can be a very expensive mistake. A simple new tool I have developed called the “T-Rex Score” demonstrates just how tyrannical fees can be, particularly for those investing in those dinosaurs of the Canadian investment world, high cost mutual funds. Allow me to explain.
Understanding Investments and How Fees Affect Compounding
Most investment fees are quoted as a percentage of the amount invested. So, a fund with 2% fees will cost you 2% of your total investments annually. This method of quotation is highly misleading for three reasons.
- Fundamental to any economic transaction is a cost–benefit analysis. Whether buying a cup of coffee, a new car or a new home, an engaged consumer compares the potential benefit offered against the price to be paid. Consciously, or probably more often subconsciously, consumers ask themselves the question, “Is the cost fair compared with the benefit offered?”. There is no reason investing should be any different. The benefit you are seeking is to earn a return on your investment. Quoting the cost as a percentage of that return would provide a more accurate representation of the cost versus the benefit received. Of course, you can’t accurately predict future investment returns, but you can use reasonable projections. For example, you might project a one-year total investment return of 6%. In this case, a fee of 2% of the total amount invested would consume 33% of the projected benefit. The same fee would consume 25% of an 8% pre-fee investment return. So, you can conclude that, assuming a pre-fee investment return of 6% to 8%, the cost of the product is somewhere between 25% to 33% of the total benefit over one year.
- When a product will be owned for years or decades, quoting the fee as an amount owing over an arbitrary fraction of that time frame (that is, one year) makes no sense. For example, a thirty-five-year-old looking to invest for a long retirement stretching from age sixty-five to age ninety-five might use a fifty-year average investment horizon, while a couple saving to finance a newborn’s post-secondary education might use a twenty-year average horizon. Quoting an annual fee doesn’t tell you much about the total cost over what is typically a multi-decade investment time frame. Providing an estimate of the total fee on the basis of your projected investment horizon would be much more revealing.
- When you pay investment fees, you lose twice. You lose the fee and you lose some of your compounding magic. Annual fee quotations give no indication that your ‘compounding loss’ accelerates as the years pass.
There is a much more revealing way to measure the impact of fees on your investments: simply project how much of your total investment return you actually get to keep after fees. This method of demonstrating the impact of investment fees, which I call the ‘Total Return Efficiency Index Score’ or ‘T-Rex Score,’ addresses the three shortcomings of the conventional fee quotation.
T-Rex Scores:
- compare cost (fees) versus benefit (gain)
- allow for a wide range of time frames
- fully capture the ever-growing compounding loss
T-Rex Scores reveal how efficiently the returns on your underlying investments translate into returns for you. The higher your T-Rex Score, the more of your investment return you get to keep. You will find the T-Rex calculator at www.larrybates.ca. Assuming you know the full amount of all investment fees you are paying, it’s very simple to project your score. The required inputs are:
- investment amount
- projected average annual return on underlying investments before fees
- annual investment product fees and other costs
- projected life of investments (time horizon)
Consider a couple of examples. Let’s assume a $10,000 investment over 30 years generates an average annual compound return of 8% before fees. What would be the impact of 0.25% annual fees (similar to many equity index ETFs)?
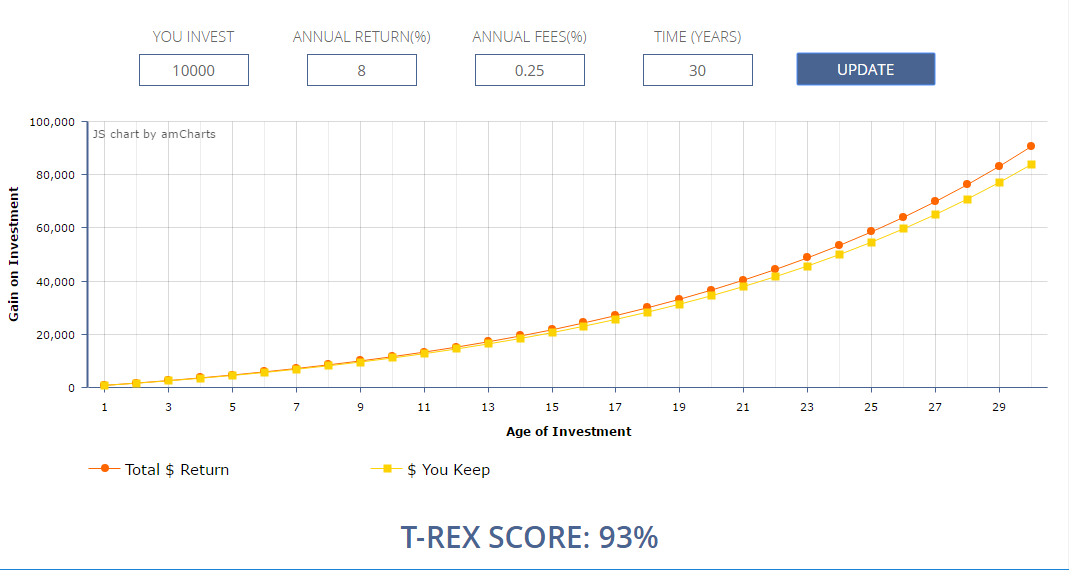
The red curve indicates the pre-fee total return over time while the yellow curve shows the return actually retained by the investor after fees. In this example, the T-Rex Score is 93% which means the investor retains 93% of the total return.
How will the results change if we assume the same investment amount, time frame and pre-fee return but increase the annual fees to 2.25% (similar to many equity mutual funds)? Of course, the total pre-fee return (red curve) remains the same. But look what happens to the yellow curve.

The return actually retained by the investor (the yellow curve) drops dramatically resulting in a T-Rex Score of 48%. The investor loses 52% of their total return to fees. The “TRUE FEE” in this case is not 2.25%…….it is 52%!
This blog post was contributed by Larry Bates – a Toronto-based consultant, speaker & author. You can find more information about him and his investment tips on his website www.larrybates.ca


Leave a Comment